Affordable & Liveable Property Guide 2nd Half 2021 - Melbourne
Median property prices in Melbourne Metro increased by 17.7% for houses to $1,160,000 from Q3 2020 to Q3 2021, and by 2.4% for units at $630,000. Between Q3 2020 – Q3 2021, the total sales in Melbourne Metro increased by 73.0% (to 5,528 sales) for houses, and by 90.0% (to 6,114 sales) for units.

Overview
Median property prices in Melbourne Metro increased by 17.7% for houses to $1,160,000 from Q3 2020 to Q3 2021, and by 2.4% for units at $630,000. Between Q3 2020 – Q3 2021, the total sales in Melbourne Metro increased by 73.0% (to 5,528 sales) for houses, and by 90.0% (to 6,114 sales) for units.
Melbourne Metro’s median price growth has occurred amidst increased sales activity, indicating real returns in capital investment and high demand. Property owners can be highly confident in their asset’s ongoing value. This may be considered a surprising outcome, as Melbourne Metro has had severe lockdowns over the past 6 months, however it speaks to the resilience of Melbourne Metro’s market and the changing economic landscape since its last severe lockdown in 2020.
A key finding in this report was that the majority of affordable and liveable suburbs identified are located within the outer ring of Melbourne Metro, largely driven by flexible working conditions due to COVID-19 lockdowns. Investors looking to purchase in those areas would benefit from higher yields and low vacancy rates that outperform the Melbourne metro benchmarks.
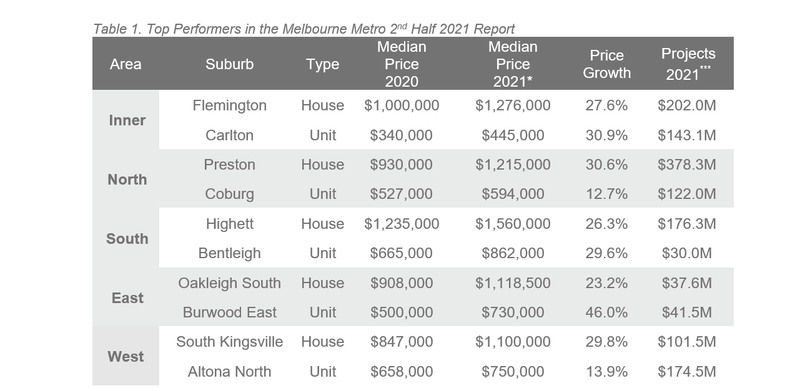
Table 1 highlights top suburbs in Melbourne Metro based on price growth and total estimated value of projects commencing in the 2nd half of 20212.
Access to Market
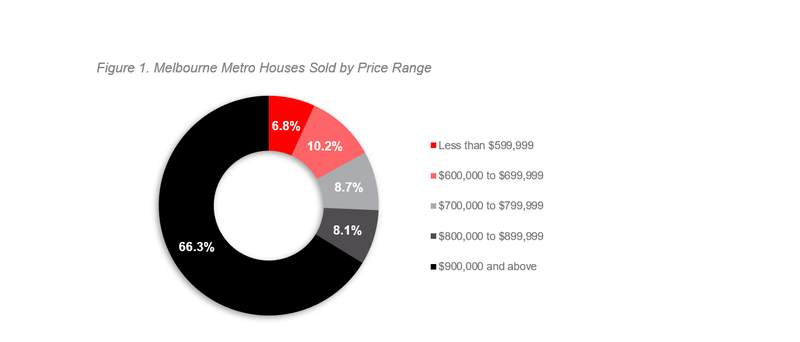
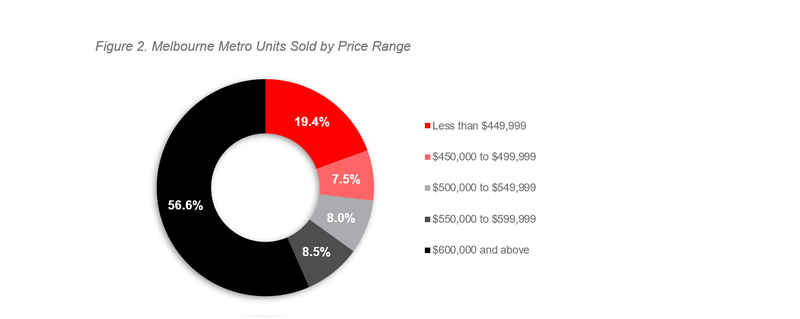
The dominant proportion of homes sold in Melbourne Metro across 2021# were in the premium price bracket of $900,000 and above (66.3%). Units also recorded a dominant premium price bracket of $600,000 and above (56.6%). Affordable options for first home buyers are still available, more so in the unit market, however have shrunk in the past 12 months.
Figure 1. Hobart Metro Houses Sold by Price Range
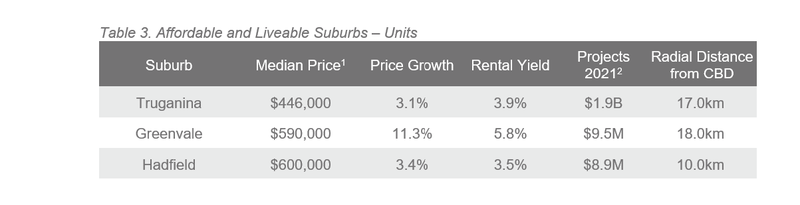
Affordable and Liveable Suburbs
To identify affordable and liveable suburbs premiums of 71% for houses and 6% for units were added to the Victoria (VIC) average home loan, which were below and on par to those required to reach Melbourne Metro’s median prices (104% for houses and 11% for units). Thus, the chosen suburbs have median property prices that are below Melbourne’s median prices, meaning that the suburbs identified within this report are more affordable for buyers.
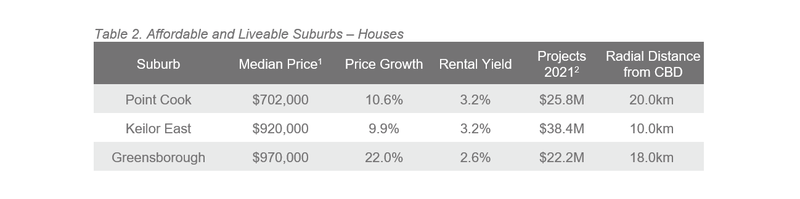
Considering all methodology criteria (property trends, investment, affordability, development, and liveability), Tables 2 and 3 identify key suburbs that property watchers should be on the lookout for.
Investment Conditions
In September 2021, house rental yields in Melbourne Metro were recorded at 2.5%. In the 12 months to Q3 2021, the median house rental price softened by -5.1% to $470 per week respectively. The Melbourne Metro rental market is looking to improve in the near future as the state is coming out of COVID-19 lockdowns and international borders are re-opening.
In September 2021, Melbourne Metro recorded a vacancy rate of 3.5%, which was above Sydney Metro (2.7%) and Brisbane Metro (1.4%). Vacancy rates in Melbourne Metro have considerably tightened since reaching a peak in December 2020 (4.7%). Melbourne Metro’s vacancy rate continues to show a declining trend since the beginning of 2021, suggesting higher rental demand as the area comes out of lockdowns and restrictions. This should provide greater confidence to investors.
Methodology
This affordable and liveable property guide for Melbourne Metro analyses all suburbs within a 20km radius of the Melbourne CBD. The following criteria were considered:
- Property trends criteria – all suburbs have a minimum of 20 sales transactions for statistical reliability purposes. Based on market conditions suburbs have either positive, or as close as possible to neutral price growth between 2020 to 2021*.
- Investment criteria – as of September 2021, suburbs considered will have an on-par or higher rental yield than Melbourne Metro, and an on-par or lower vacancy rate.
- Affordability criteria – identified affordable and liveable suburbs have a median price below a set threshold. This was determined by adding percentage premiums to the VIC average home loan, which was $568,188** as of Q2 2021. Premiums of 71% for houses and 6% for units were added, which were below those required to reach Melbourne Metro’s median prices (104% for houses and 11% for units). This places the chosen suburbs below Melbourne’s median prices, meaning that the suburbs identified within this report are more affordable for buyers.
- Development criteria – suburbs identified must have a high total estimated value of future project development for the 2nd half of 2021, as well as a higher proportion of commercial and infrastructure projects. This ensures the suburbs show signs of sustainable economic growth, and in turn, positively affect the property market.
- Liveability criteria – all identified suburbs have low crime rates, availability of amenities within a 5km radius (i.e. schools, green spaces, public transport, shopping centres and health care facilities), and an unemployment rate on-par or lower in comparison to the VIC average (as determined by the Department of Jobs and Small Business, June Quarter 2021 release).
Popular


Connect with us