National Affordable & Liveable Property Guide 1st Half 2021
The PRD Affordable and Liveable Property Guides 1st Half 2021 are available for Brisbane, Sydney, Melbourne, and Hobart. These guides provide valuable insights and highlights of the market and report on many key indicators to create a holistic picture of property conditions in each capital city.

Overview
The PRD Affordable and Liveable Property Guides 1st Half 2021 are available for Brisbane, Sydney, Melbourne, and Hobart. These guides provide valuable insights and highlights of the market and report on many key indicators to create a holistic picture of property conditions in each capital city.
PRD Affordable and Liveable Property Guides 1st Half 2021 - Brisbane
PRD Affordable and Liveable Property Guides 1st Half 2021 - Sydney
PRD Affordable and Liveable Property Guides 1st Half 2021 - Melbourne
PRD Affordable and Liveable Property Guides 1st Half 2021 - Hobart
There are three key findings in the 1st Half 2021 reports:
1. Sydney proves to be the most affordable city for liveability, where residents can purchase a house in a liveable suburb for 87% less (premium added to New South Wales average home loan) than the premium needed to purchase in Sydney Metro. Melbourne Metro is the runner up at 42% less, and Brisbane third at 16% less. Sydney’s premium difference in the 1st Half 2021 report is higher than the 2nd Half 2020ϖ report, of 70%. This is extremely advantageous for first home buyers
2. The geographic pocket of affordable and liveable chosen suburbs has remained stable for Sydney (south and south-west) and Hobart (equally spread), as per the 2nd Half 2020ϖ report. Melbourne has shifted from chosen suburbs being equally spread, to being mostly in the northside, whereas first home buyers in Brisbane can now find affordable and liveable chosen suburbs in both north and south-side of the CBD, a contrast from the northern centric of the 2nd Half 2020ϖ report.
3. Hobart is no longer a capital city where residents must sacrifice affordability for liveability, as per 1st Half 2020µ and 2nd Half 2020ϖ reports. Residents now only need to pay a premium of 57% (for houses), and 25% (for units) above the Tasmanian (TAS) average home loan, to secure a highly liveable suburb. These premiums are now lower than the percentage required to purchase a median-priced property in Hobart Metro (71% for houses and 39% for units).
Cost of Liveability
Table 1 illustrates the difference between the required premium percentage (added to the state average home loan3 for each capital city) to reach the respective City Metro median price, and the premium percentage required to identify affordable and liveable suburbs which met all methodology criteria (liveability, investment, and project development).
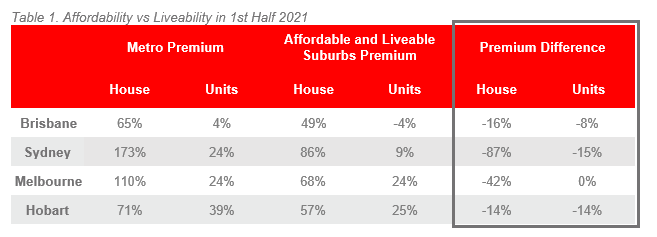
It is important to note that these premium percentages are affected by two key variables:
- median price movements in the market, and
- the ability of a suburb to meet the liveable criteria
Sydney continues to be the most affordable city for liveability, continuing to record the largest negative premium difference for houses and units, both in the 1st Half 2021 and 2nd Half 2020ϖ reports. This is good news for first home buyers, who may believe they have to sacrifice liveability aspects in gaining access into suburbs with a lower median property price than Sydney Metro.
This finding may surprise many, as Brisbane and Hobart are originally thought of as the more affordable capital cities. Whilst this might be true from a median property price perspective, many affordable suburbs in both capital cities fail to satisfy other criteria such as liveability, investment return, and future project development plans.
The biggest swing in the cost of liveability comes from Hobart, as residents no longer need to sacrifice affordability for liveability. Previously in the 2nd Half 2020ϖ report, Hobart buyers needed to pay +30% (for houses) and +14% (for units) on top of the Hobart Metro premium to secure a liveable suburb. However now in the 1st Half 2021, they can do so -14% (for houses) and -14% (for units) less than the Hobart Metro premium.
For Hobart residents, this is a definite win and an exciting progression in the property market. This opens more possibilities for first home buyers, who now have more suburbs to choose from and do not need to sacrifice liveability items to ensure they can afford the median price. Although a systemic undersupply in new housing stock exists, due to low levels of residential projects, there are enough commercial and infrastructure projects in certain areas that allowed other methodology criteria of this report to be satisfied. It is a step in the right direction for Hobart and one that is hoped to be sustained.
Melbourne unit buyers are perhaps the most disadvantaged in the 1st Half 2021 report, as they must be prepared to pay on par to the Melbourne Metro median price to secure liveable suburbs. Thus, the cost of liveability is the highest for this demographic of buyers, however, there is comfort in the fact that they do not need to pay above the Melbourne Metro median price.
Access to Market
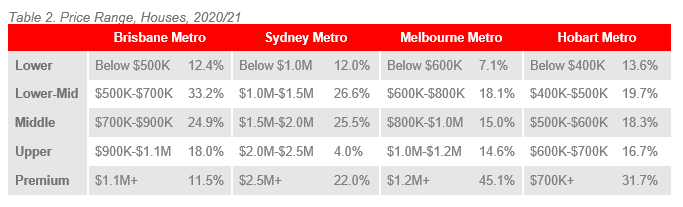
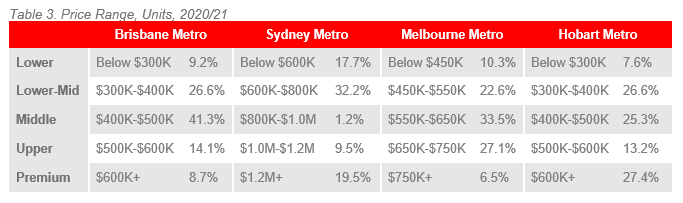
An analysis of price point sales, or access to market, highlights significant findings.
Firstly, Sydney and Brisbane can continue to be
classified as a haven for first home buyers, as was the case in the 2nd Half
2020ϖ report. The bulk of sales in Sydney (38.6% for house and
49.9% for units) and Brisbane (45.6% for house and 35.8% for units) are in the combined
lowest and lower-middle price brackets, albeit a significant difference in
actual median property prices.
Second, the Melbourne market has had a recovery in its
market demand, with an increasing number of sales making up the middle, upper,
and premium price brackets. In the 2nd Half 2020ϖ report,
31.9% of unit sales were in these price brackets, whereas now it has shifted to
67.1%. For houses, it increased from 67.0% in the 2nd Half 2020ϖ
report to 74.7% in the 1st Half 2021.
Thirdly, Hobart is no longer the least friendly market
for first home buyers. Instead, this title has shifted to Melbourne. The
combined sales of the lowest and lower-middle price brackets for Hobart was
33.3% for houses and 34.2% for units; higher than Melbourne’s 25.2% (house) and
32.9% (units).
Lastly, Sydney remains the most expensive capital city
for both houses and units, with its middle price brackets being the highest priced.
For example, a middle-priced house in Brisbane sits within $700K-$900K, whereas
in Sydney it is $1.5M-$2.0M – essentially double the price.
Affordable & Liveable Suburbs - National
Considering all methodology criteria (property trends, investment potential, affordability, project development, and liveability factors), Table 4 identifies key affordable and liveable suburbs which property watchers should look out for in 2021.
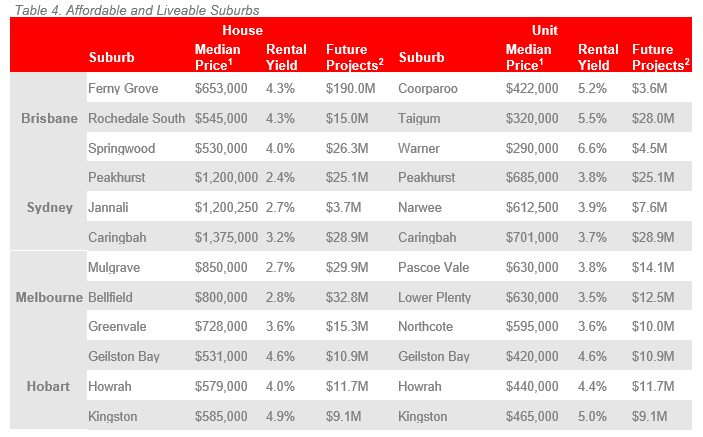
Sydney and Melbourne continue to have the highest entry prices, with the lowest rental yields. This is a similar pattern to the 1st Half 2020µ and 2nd Half 2020ϖ reports, despite COVID-19 restrictions and further lockdowns in both capital cities.
Parts of Hobart have now overtaken Brisbane in median property prices, some with lower rental yield. This carries a danger for local future first home buyers. Current first home buyers have recently been able to compete thanks to current Government schemes and a historically low interest rate. However, with the continuous increase in property prices and no significant supply relief, future first home buyers may be further disadvantaged.
Brisbane continues to be the capital city that provides house buyers and investors the most “bang for buck”, a title it has carried for the past 3 years. In the 2nd Half 2020ϖ report, this was true for its units’ market, however, in the 1st Half 2021 report, it is for both property types.
Methodology
Each report focuses on suburbs within a 20km radius of the CBD (or 10km for Hobart), taking into consideration the following criteria:
- Property trends criteria – all suburbs have a minimum of 20 sales transactions (or 10 transactions for Hobart) for statistical reliability purposes. Based on market conditions, suburbs have either positive or as close as possible to neutral price growth between 2019 to 2020/211.
- Investment criteria – as of March 2021, all suburbs considered will have a similar or higher rental yield than the relevant City Metro area and a similar or lower vacancy rate.
- Affordability criteria – identified suburbs have a median price below a set threshold. This threshold was set by adding a percentage premium to the respective state’s average home loan3. This percentage premium must result in a price threshold below the City Metro area’s median price in order to ensure affordability.
- Development criteria – suburbs identified must have a high total estimated value of future project development for the 1st half of 20212, as well as a higher proportion of commercial and infrastructure projects. This ensures the suburbs show signs of sustainable economic growth, in turn positively affecting the property market.
- Liveability criteria – all identified suburbs have low crime rates, availability of amenities within a 5km radius (i.e. schools, green spaces, public transport, shopping centres and health care facilities), and an unemployment rate on-par or lower in comparison to the State average (as determined by the Department of Jobs and Small Business, December Quarter 2020 release).